Basic Usage
Plotting Class Inheritance
[1]:
from inheritance_explorer import ClassGraphTree
import numpy as np
[2]:
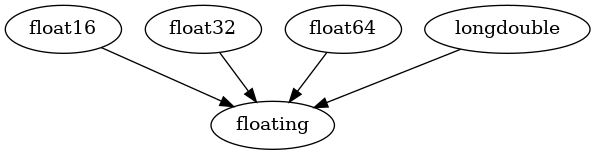
base_class = np.floating
cgt = ClassGraphTree(base_class)
cgt.show_graph()
[2]:
[3]:
base_class = np.ndarray
cgt = ClassGraphTree(base_class)
cgt.show_graph()
[3]:

[ ]:
Additional function tracking
If you supply a function name via the funcname argument, then that function will be tracked as the classes are traversed. Any child class that overrides the function will be flagged and the actual source code of the function will be stored. After traversal, a code-similarity matrix between all classes that over-ride the function.
This is best illustrated with an example:
[4]:
from matplotlib.axes import Axes

cgt = ClassGraphTree(Axes, funcname='clear')
cgt.show_graph()
[4]:
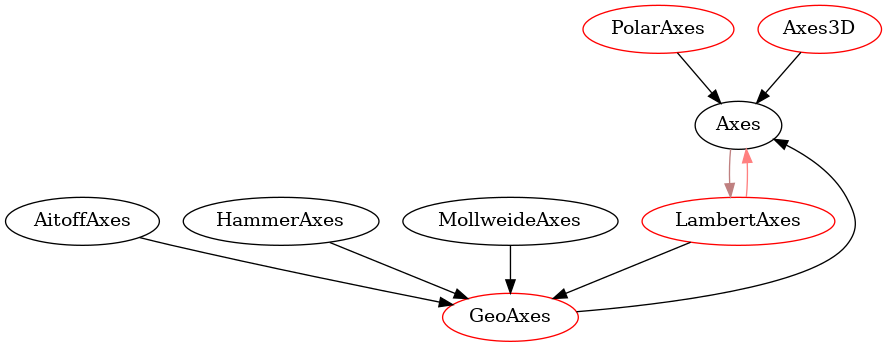
here, we’re mapping out the matplotlib Axes class and tracking the clear() function. Any methods after the main parent that override clear are highlighted in red. Any classes that override and look similar (see below) are connected with additional arrows (red and brown).
In the interactive graph, the same information is displayed, with overriding classes as purple nodes nad similar nodes connected by blue lines:
[ ]:
We display the actual similarity coefficient matrix used to identify similar nodes:
[5]:
cgt.plot_similarity()
[5]:
({0: 'Axes', 1: 'GeoAxes', 2: 'LambertAxes', 3: 'PolarAxes', 4: 'Axes3D'},
 <Axes: >)

The above plot is the code inter-comparison between every class that overrides clear(). A value of 1 is identical (the diagonal of this plot will always be 1) and a value of 0 is no similarity.
Furthermore, the actual source code is recorded during traversal, which you can inspect inividually:
[6]:
from IPython.display import Code
Code(cgt.get_source_code('PolarAxes'), language="python")
[6]:
def clear(self):
    # docstring inherited
    super().clear()

    self.title.set_y(1.05)

    start = self.spines.get('start', None)
    if start:
        start.set_visible(False)
    end = self.spines.get('end', None)
    if end:
        end.set_visible(False)
    self.set_xlim(0.0, 2 * np.pi)

    self.grid(mpl.rcParams['polaraxes.grid'])
    inner = self.spines.get('inner', None)
    if inner:
        inner.set_visible(False)

    self.set_rorigin(None)
    self.set_theta_offset(self._default_theta_offset)
    self.set_theta_direction(self._default_theta_direction)
or as a group:
[7]:
src_dict = cgt.get_multiple_source_code('LambertAxes', 'GeoAxes', 'Axes')

Code(src_dict['Axes'], language="python")
[7]:
def clear(self):
    """Clear the Axes."""
    # Act as an alias, or as the superclass implementation depending on the
    # subclass implementation.
    if self._subclass_uses_cla:
        self.cla()
    else:
        self.__clear()
[8]:
Code(src_dict['GeoAxes'], language="python")
[8]:
def clear(self):
    # docstring inherited
    super().clear()

    self.set_longitude_grid(30)
    self.set_latitude_grid(15)
    self.set_longitude_grid_ends(75)
    self.xaxis.set_minor_locator(NullLocator())
    self.yaxis.set_minor_locator(NullLocator())
    self.xaxis.set_ticks_position('none')
    self.yaxis.set_ticks_position('none')
    self.yaxis.set_tick_params(label1On=True)
    # Why do we need to turn on yaxis tick labels, but
    # xaxis tick labels are already on?

    self.grid(mpl.rcParams['axes.grid'])

    Axes.set_xlim(self, -np.pi, np.pi)
    Axes.set_ylim(self, -np.pi / 2.0, np.pi / 2.0)
[9]:
Code(src_dict['LambertAxes'], language="python")
[9]:
def clear(self):
    # docstring inherited
    super().clear()
    self.yaxis.set_major_formatter(NullFormatter())
Additionally, from a Jupyter notebook, you can use cgt.display_code_comparison() to spawn the Code Comparison Widget (see the Examples page for a demonstration).
Interactive Graph
In a jupyter notebook, you can construct a pyvis interactive graph from a ClassGraphTree instance, cgt with:
graph = cgt.build_interactive_graph(width="400px",
                                    height="400px",
                                    bgcolor='#222222',
                                    font_color='white') # constructs a pyvis interactive graph
graph.show('_tmp.html')  # render the pyvis interactive graph here!
Limitations
Note that while the class inheritance structures should be well behaved for most code bases, the source code comparison is limited by the type limitations of the underlying inspect library.
The sum method for numpy arrays, for example, is a method_descriptor:
[10]:
type(np.ndarray.sum)
[10]:
method_descriptor
which inspect.get_source cannot handle. So if we try to track sum across the class structure with:
base_class = np.ndarray
cgt = ClassGraphTree(base_class, funcname = 'sum')
we will get a TypeError similar to the following:
--> 677 raise TypeError('module, class, method, function, traceback, frame, or '
    678                 'code object was expected, got {}'.format(
    679                 type(object).__name__))

TypeError: module, class, method, function, traceback, frame, or code object was expected, got method_descriptor
[ ]: